Review of Computer Energy Consumption and Potential Savings
After lighting, computers and monitors have the highest energy consumption in office environments.
White Paper - December 2006 - Megan Miln (née Bray)
Sponsored by Dragon Systems Software Limited (DssW)
Summary
After lighting, computers and monitors have the highest energy consumption in office environments. Studies have shown that power management of computers and monitors can significantly reduce their energy consumption, saving hundreds or thousands of dollars a year on electricity costs.
The energy consumption of computers and monitors is determined by the amount of energy they require to operate and how they are used. While the energy requirements of a device make an important contribution to its overall energy consumption, the key to reducing energy consumption is changing how devices are used.
Approximately half of all office computers are left on overnight and on weekends. Evenings and weekends account for 75% of the week, so ensuring computers are turned off at night dramatically reduces their energy consumption. Further savings are made by ensuring computers enter low power mode when they are idle during the day.
Power management is a way of ensuring computers and monitors are turned off when not required and in low power mode during idle periods.
Manual power management, which relies on education users to turn off their computers, can achieve impressive results with ongoing education and reinforcement. Alternatively, automatic power management relies on software, or built in energy saving features. Theoretically, automatic power management can achieve 100% power management, with all computers turned off when not required and in low power mode when idle.
Acronyms and abbreviations
- CRT
- Cathode ray tube
- kWh
- Kilowatt hours
- LCD
- Liquid crystal display
- PM
- Power management (indicates the device enters low power mode after a period of idle time)
- W
- Watts
Introduction
Computers and monitors account for 40%-60% of the energy used by office equipment. Their energy consumption is second only to office lighting (Picklum et al: 1999, Roth et al: 2002).
Reducing the energy consumption of computers and monitors is simple. A power managed computer consumes less than half the energy of a computer without power management,[1] and depending on how your computers are used, power management can reduce the annual energy consumption of your computers and monitors by 80%.[2]
The average computer and monitor use 30% of their energy while idle and 40% of their energy outside business hours (Kawamoto et al: 2004). Power management reduces the energy consumed by computers and monitors while they are not in use. This represents a clear opportunity for saving money on energy costs.
The energy consumption of computers and monitors is influenced by two factors:
1. The energy required to run the device, or the power draw;
2. How and when the device is used, that is, its usage pattern.
This document reviews studies on computer energy consumption and usage patterns. All of these studies indicate that effective power management significantly reduces the energy consumption of computers and monitors.
We begin by looking at the energy requirements and usage patterns of computers and monitors. This is followed by estimates of the annual energy consumption of computers and monitors. Finally, we discuss the potential savings that power management can achieve.
Background
This document focuses on research results for desktop computers and their monitors in commercial environments. Although some of the studies include data for server and mainframe computers, we have not included them here, as they tend to have different power management requirements to desktop computers. We have included a discussion on laptop computers for comparison with desktop computers, and because anecdotal evidence suggests they are replacing desktop computers in some office environments.[3]
The research sites documented in the studies are predominantly public sector offices, but sites also include schools, universities, and large and small private sector offices. We have not differentiated between different types of research sites in this document, although some studies suggest computer usage patterns may differ between the public and private sector.[4]
Terminology
We have adopted the terms ‘active’, ’low power’, and ‘off’ to describe the different power states of computers and monitors. These terms are used by a number of the studies. ‘Active’ refers to when the computer is turned on ready for use, but not necessarily being used. ‘Low power’ encompasses commonly used terms such as ‘sleep’ or ‘suspend’. Where a device has multiple low power settings, ’low power’ refers to the lowest of these settings. ‘Off’ describes a device that is turned off but still connected to mains power.
We also make a differentiation between energy requirements and energy consumption. The energy requirement of a device refers to how much power the device requires to operate at a given moment. The energy consumption of a device refers to how much electricity the device uses over a period of time. Energy consumption is a function of the energy requirement of a device and how it is used.
Energy consumption of computers and monitors
The energy consumption of computers and monitors is determined by their energy requirements and their usage pattern. This section looks at both of these factors and how their interaction influences annual energy consumption.
Energy requirements of computers and monitors
Computers and monitors vary in the amount of energy they require.
The energy efficiency of computers and monitors has improved over time, which reduces their energy requirements. However, at the same time increased processing power in computers, and higher resolution monitors have increased energy requirements. As a result, newer computers and monitors tend to use more energy when they are active, but less energy in low power mode than older computers and monitors. Newer computers are also more likely to have power management features than older computers.
The energy requirements of computers and monitors are indicated by their power draw. The power draw, measured in watts (W), is an indication of how much energy a device requires at any given moment.
Computers
There is huge variation in energy required by different computers. The average computer requires between 36W and 250W when it is active, and between 1W and 27W in low power mode.
Computers, like many other electrical devices, draw power even when they are turned off. The average computer draws between 1.5W and 3W when it is turned off but plugged into a mains socket.
A number of studies have looked at the power draw of computers, with different results. Table 1 summarises these results.
Description | Power draw (watts) | Source | ||
Active | Low power | Off | ||
Desktop | 55 | 25 | 1.5 | Kawamoto et al (2001) |
Desktop | 55 | 25 | 1.5 | Kawamoto et al (2004) |
Desktop with power management | 36 | 27 | - | Mungwititkul and Mohanty (1997) |
Desktop without power management | 48 | - | - | Mungwititkul and Mohanty (1997) |
Desktop manufactured 2000-2001 | 70 | 9 | 3 | Roberson et al (2002) |
Integrated computer system manufactured 2000-2001 | 54-131 | 4-31 | 4-8 | Roberson et al (2002) |
Desktop | 60-250 | 1-6 | - | Bluejay (2006) |
Desktop (pentium and pre-pentium) | 55 | 25 | 0 | Nordman (1999) |
Desktop (Macintosh) | 50 | 48 | 0 | Nordman (1999) |
Table 1: Energy requirements of computers
The difference in the energy requirements of newer and older computers is highlighted by two studies: one by Roberson et al (2002), and the other by Kawamoto et al (2001).
The study by Roberson et al (2002) looked at computers manufactured between July 2000 and October 2001. The study by Kawamoto et al (2001), which was done around the same time, looked at existing computers in office sites As such these computers were a mix of older models manufactured before 2001.
These studies show that, on average, newer computers use 70W when active and 9W in low power mode (Roberson et al: 2002), whereas older computers use 55W when active and 25W in low power mode (Kawamoto et al: 2001).[5]
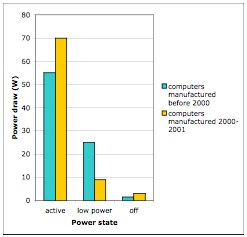
Figure 1: Energy requirements of old and new computers (source: Roberson et al: 2002, Kawamoto et al: 2001)
Monitors
Monitors, like computers, vary in the amount of energy they require. The average CRT monitor requires between 66W and 135W when active, between 0W and 19W in low power mode, and between 0W and 5W when switched off.
Table 2 summarises the results of studies looking at the power draw of different monitors.
Newer monitors are more energy efficient than older monitors. Two factors contribute to the increased energy efficiency of monitors:
1. New CRT monitors require less energy than older CRT monitors of equivalent size;
2. LCD monitors require much less energy than CRT monitors.
The two studies by Roberson et al (2002), and Kawamoto et al (2001) highlight the difference in energy requirements between newer CRT monitors and older CRT monitors.
Description | Power draw (watts) | Source | ||
Active | Low power | Off | ||
CRT | 85 | 5 | 0.5 | Webber et al (2006) |
CRT with power management | 66 | 15 | - | Mungwititkul and Mohanty (1997) |
CRT without power management | 67 | - | - | Mungwititkul and Mohanty (1997) |
CRT 17" | 80 | 0-15 | 0 | Bluejay (2006) |
CRT 15" | 75 | 10 | 0 | Nordman (1999) |
CRT 17" | 90 | 10 | 0 | Nordman (1999) |
CRT 21" | 120 | 10 | 0 | Nordman (1999) |
CRT 14"-15" | 61 | 19 | 3 | Roth et al (2002) citing Macebur (1998) |
CRT 17"-21" | 90-135 | 9-16 | 4-5 | Roth et al (2002) citing Macebur (1998) and Meyer and Schaltegger (1999) |
CRT and LCD average | 55 | 5 | 1 | Roberson et al (2002) |
CRT 15"-21" | 76 | 7 | 1 | Roberson et al (2002) |
LCD 15"-18" | 30 | 2 | 2 | Roberson et al (2002) |
LCD | 15 | 1.5 | 0.5 | Webber et al (2006) |
LCD 17" | 35 | 0-15 | 0 | Bluejay (2006) |
Table 2: Energy requirements of monitors
The study by Roberson et al (2002) looked at monitors manufactured between July 2000 and October 2001. The study by Kawamoto et al (2001) looked at existing monitors in office sites, as such these monitors were a mix of older models manufactured before 2001.
These studies show that, for 17 inch CRT monitors, the newer models require 61W when active, 2W in low power mode, and 1W when turned off (Roberson et al: 2002). In contrast, the older models require 85W when active, 5W in low power mode, and 0.5W when turned off (Kawamoto et al: 2001).
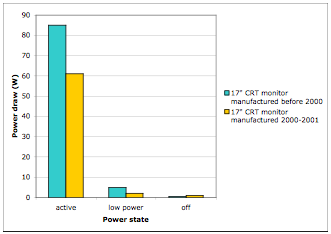
Figure 2: Energy requirements of old and new CRT monitors (source: Roberson et al: 2002, Kawamoto et al: 2001)
LCD monitors require a fraction of the energy of CRT monitors. The average LCD monitor requires 15W when active, 1.5W in low power mode, and 0.5W when turned off (Kawamoto et al: 2004).
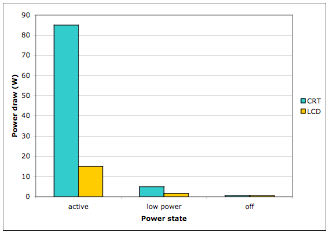
Figure 3: Energy requirements of CRT and LCD monitors (source: Kawamoto et al: 2004)
Anecdotal evidence suggests that although offices may update their computers regularly, they do not update their monitors as regularly. On average, only 17% of office monitors are LCD (Webber et al: 2006).
The size of a monitor makes a significant contribution to its energy requirement.
On average, CRT monitors require 0.53W/inch2, and LCD monitors require 0.23W/inch2. However, the research suggests that difference in energy consumption between CRT monitors and LCD monitors decreases as size increases (Roberson et al: 2002).[6]
Conclusions
As expected, all the studies indicate that computers and monitors use much more power when they are active compared to when they are in low power mode or turned off. This is true for both older and newer models.
Computers and monitors vary significantly in their power requirements. Computers and monitors with a lower power draw can make a contribution to reducing energy costs. It appears the most significant savings would be achieved by replacing CRT monitors with LCD monitors.
Usage patterns of computers and monitors
The power draw of computers and monitors is only one factor affecting total energy consumption. The energy efficiency of a computer makes a small contribution to its total energy consumption. The way in which a computer is used is a far more significant factor in determining the total energy consumption.
An energy efficient computer that is always on consumes more energy than a less energy efficient computer that is regularly turned off.
Looking at typical usage patterns of computers and monitors provides a clearer picture of how their total energy consumption can be reduced than simply looking at energy requirements.
Usage patterns are typically separated into two periods: nighttime usage, which usually includes weekends, and daytime usage.
Nighttime usage
On average, only half of all computers and monitors are turned off at night. In some cases computers are left on overnight to allow back-ups or maintenance to occur, but in other cases there is no obvious reason for computers to be left on.
The study by Webber et al (2001) found, on average, 44% of computers were turned off at night, 3% were in low power mode, and the remainder, approximately 54% of computers, were active.
This study found huge variability in turn off rates. At some research sites only 2% of computers were turned off, while at other research sites 91% of computers were turned off.[7]
A more recent study by Webber et al (2006) found, on average, only 36% of computers were turned off at night, 4% of computers were in low power mode, and the remainder, 60%, were active.
Other studies have found a much higher proportion of computers are turned off at night.
A study by Kawamoto et al (2001) found 65% of computers were turned off at night and the remaining 35% were active.
A study by Nordman et al (2000) also found, on average, 65% of computers were turned off at night, 10% were in low power mode, and 25% were active. This study compiled the data from 17 previous studies conducted between 1990 and 2000. Like other studies, this study also showed huge variability in turn off rates, which ranged from 0%- 91% of computers turned off at night.
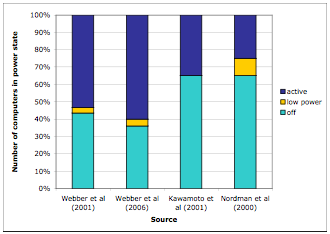
Figure 4: Nighttime power state of computers
The picture for monitors is slightly different. The studies have shown a much lower proportion of monitors are active at night.
The earlier study by Webber et al (2001) found 32% of monitors were turned off, 38% were in low power mode, and 30% were active.
The recent study by Webber et al (2006) showed similar results. For CRT monitors, 32% were turned off, 49% were in low power mode, and 19% were active. For LCD monitors, 18% were turned off, 61% were in low power mode, and 21% were active.
As with computers, the study by Nordman et al (2000) found a much higher proportion of monitors are turned off at night. They found 65% were turned off, 20% were in low power mode, and 15% were active.
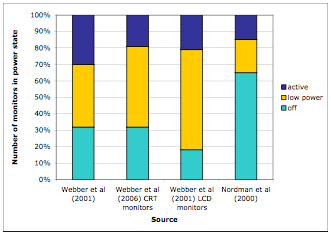
Figure 5: Nighttime power state of monitors
A surprising number of computers and monitors are left on at night. Significantly, most of the computers and approximately half of the monitors are active, not in low power mode.
As the studies of power draw indicate, computers and monitors consume much more energy when they are active than they do in low power mode. Reducing the time computers and monitors spend unnecessarily in active mode will reduce their energy consumption.
In a 9 to 5 office, computers are used for less than 25% of the week (Webber et al: 2001). Ensuring computers are turned off at night reduces their running time by 75%. This represents an opportunity to make significant savings on energy consumption and electricity costs.
Daytime usage
The way in which computers are used during the day is also important. Of the 25% of the week the average computer is in use, a significant proportion is likely to be idle time.
A study by Kawamoto et al (2004) found that in the average office, a computer is used for 6.9 hours a day. Of those 6.9 hours it is in active use for 3 hours, and idle for the remaining 3.9 hours.
A computer which is actively used 3 hours a day, 5 days a week, is only in use 9% of the week.
The study by Mungwititkul and Mohanty (1997) and the study by Nordman (1999) both found that on average, computers are active for 9% of the year.
Ensuring computers are in low power mode during these idle periods further reduces their energy consumption.
Effect of idle time delay
It is unrealistic to assume that a computer is put into low power mode as soon as it becomes idle. Power managed computers usually enter low power mode after a specified delay. The length of the delay affects how much of the idle time the computer spends in active mode and how much of the idle time it spends in low power mode.
The study by Kawamoto et al (2004) found that the average computer is idle for 3.9 hours a day. If a computer goes into low power mode after 5 minutes of idle time it will spend 76% of those 3.9 hours in low power mode. If a computer goes into low power mode after 30 minutes of idle time it will spend just 34% of those 3.9 hours in low power mode.
The best length for the delay period will be determined by how the computer is used. Someone who spends a lot of time reading on screen will need a longer delay period than someone who spends most of their time typing.
Total idle time = 3.9 hours per day | |||
Idle time delay (minutes) | Idle time in active mode (hours) | Idle time in low power mode (hours) | Time in low power mode (%) |
5 | 0.9 | 3 | 76 |
15 | 1.9 | 2 | 51 |
30 | 2.6 | 1.3 | 34 |
60 | 3.1 | 0.8 | 20 |
Table 3: Effect of idle time delay on power state (source: Kawamoto et al: 2004)
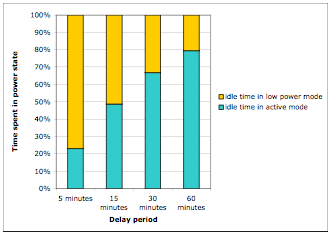
Figure 6: Effect of idle time delay on power state (source: Kawamoto et al: 2004)
Conclusions
Turning computers and monitors off at night and putting them into low power mode when idle represents a significant saving in energy consumption. Almost half of the computers studied are active 100% of the time. Turning them off at night would reduce the time they spend active to 25% of the time. Turning them off at night and putting them into low power mode when idle would further reduce the time they spend active to less than 10% of the time.
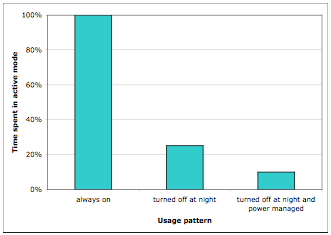
Figure 7: Percentage of time in active mode for different usage patterns (source: Webber et al: 2001, Kawamoto et al: 2004)
Laptop computers: Energy requirements and usage patterns
Many of the energy efficient features in desktop computers were originally developed for laptop computers to prolong the time they could run off the battery.
Laptop computers consume a fraction of the energy of desktop computers. This is due to a number of factors:
- They draw less power;
- They go into low power mode more quickly than desktop computer to preserve battery power;
- They are more frequently turned off and unplugged than desktop computers.
Power draw
The study by Kawamoto et al (2001) found that laptops require between 12W and 22W when active, between 1.5W and 6W in low power, and between 1.5W and 2W when turned off if the battery is fully charged.
This study calculated that on average laptops require 15W when active, compared to 55W for active desktops, 3W in low power mode, compared to 25W for desktops in low power mode, and 2W when turned off, compared to 1.5W for desktops which are off.
Another study (Roberson et al: 2002) found similar results; laptop computers require 19W when active, and 3W in low power mode, whereas desktop computers use 70W when active and 9W in low power.
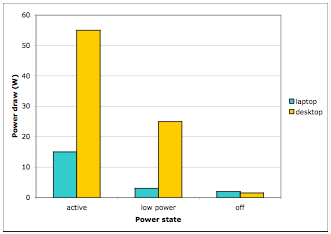
Figure 8: Energy requirements of laptop and desktop computers (source: Kawamoto et al: 2001)
Few studies consider the energy required to charge a laptop computer. The study by Nordman (1999) suggests that a laptop which is charging draws 12-24W when plugged in but turned off.
Usage pattern
There has been little detailed research done on the usage patterns of laptop computers. In part, this is because the methods used to determine usage patterns of desktop computers, such as night audits, do not give a complete picture for laptop computers. The portable nature of laptop computers means people have often taken them home when the audits take place. There was no data in the studies on how a ‘work’ laptop is used by an employee at home.
However, the research that has been done shows some important differences in the use laptop computers and desktop computers.
On average laptop computers spend more time turned off and in low power mode than desktop computers.
The study by Kawamoto et al (2004) found that 97% of laptop computers were turned off at night, compared to 82% of desktop computers turned of at night.[8]
The study by Roberson et al (2002) found that most laptop computers had light sleep mode. This mode draws less energy than active mode, but more energy than low power mode. Laptop computers require 11W in light sleep.
Anecdotal evidence suggests that laptop computers enter light sleep after a very short period of idle time before entering low power mode after longer periods of idle time. The purpose of light sleep is to prolong battery power when the laptop is not plugged into a mains socket. This feature also makes laptops much more energy efficient when they are plugged in.
A study by Roth et al (2002) shows that the average annual energy consumption of a laptop computer is less than 15% of the annual energy consumption of a desktop computer. A large proportion of this saving is due to the different usage patterns of laptop and desktop computers. Whereas desktop computers spend most of the time in active mode, laptop computers spend most of the time in low power mode. They assume that desktops and laptops spend the same amount of time turned off.
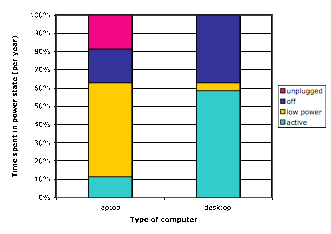
Figure 9: Typical usage pattern of laptop and desktop computers (source: Roth et al: 2002)
Annual energy consumption of computers and monitors
Annual energy consumption ranges from 52kWh to 482kWh per year for computers, and from 22kWh to 754kWh per year for monitors.
The annual energy consumption of the average office computer and monitor is influenced by two factors:[9]
1. Different energy requirements of individual computers;
2. Different usage patterns and user behaviour.
Over the course of a year, these differences can have a huge effect on the total energy consumption.
Table 4 and Table 5 summarise the results of five studies that measured the annual energy consumption of computers and monitors.
Annual energy consumption (kWh/year) | Usage pattern | Power draw (watts) | Assumptions | Source |
297 | active= 5131h/year low power= 375h/year off= 3254h/year | active=55 low power=25 0ff=1.5 | The usage pattern is an average of power managed and non power managed computers. Assumes 25% of computers are power managed. | Roth et al (2002) |
213 | active= 19h/week low power= 61h/week off= 88h/week | active= 55 low power= 25 off= 1.5 | The usage pattern is for power managed computers. For non power managed computers, the time given for low power is assumed to be active time. Assumes 25% of computers are power managed and 65% are turned off at night. | Kawamoto et al (2001) |
80 | no energy saving features | active= 48 (non-PM computers) | Assumes all computers are turned off at night. Assumes typical usage pattern for all computers is: active= 9%, low power= 10%, off= 81% of the year. | Mungwititkul and Mohanty (1997) |
60 | energy saving disabled | active= 36 (PM computers) low power= 27 | ||
52 | energy saving enabled | |||
482 | always on (on= 99%) | active=55 low power=25 0ff=1.5 | Annual energy consumption assumes 235 business days per year, based on 25 days off per year for holidays, sickness, and travel. Note: the figures reported in the study do not equal 100%. | Webber et al (2006)[10] |
254 | always on + PM (on= 13%, low= 86%) | |||
100 | off at night (on= 18%, off= 81%) | |||
86 | off at night + PM (on= 13%, low= 5%, off= 81%) | |||
199.1 | non energy star compliant (active= 9.5h/day, off=14.5h/day | Assumes 25% of computers are always on, and only 76% of computers are on for any given weekday. | Nordman (1999) | |
114.6 | energy star compliant (active= 4h/day, low= 5.5h/day, off= 14.5h/day) |
Table 4: Annual energy consumption of computers
Explaining variation in annual energy consumption.
The annual energy consumption of computers reported by the studies ranges from 52kWh per year to 482kWh per year. How do different studies achieve such different results?
The studies can be divided into two groups: those that calculate one annual energy consumption figure, which is an average of all computers in all power states, and those that calculate different annual energy consumption figures for different usage patterns.
Two of the studies (Roth et al: 2002, Kawamoto et al: 2001) calculate the annual energy consumption as an average of computers in all power states (that is, active, low power, and off). The study by Roth et al (2002) assumes 25% of computers have power management features. The study by Kawamoto et al (2001) also assumes that 25% of computers have power management features, and that 65% of computers are turned off at night. Both of these studies assume the same power draw for computers, so the difference between their results is explained by the different usage patterns they have used.
The other three studies (Webber et al: 2006, Mungwititkul and Mohanty: 1997, Nordman: 1999) calculate the annual energy consumption for computers in different power states.
The study by Webber et al (2006) calculates annual energy consumption of computers with the same power draw, but four different usage patterns: always on, turned off at night, always on with power management features, and turned off at night with power management features.[11] This study highlights the dramatic effect that different usage patterns can have on total energy consumption.
The annual energy consumption found by the other two studies results from differing usage patterns and power draw in each of the states they describe.
The study by Mungwititkul and Mohanty (1997) uses different power draws for computers that have energy saving features, and those that do not have energy saving features.
This study (Mungwititkul and Mohanty: 1997) gives one typical usage patterns for office computers. It does not provide individual usage patterns for the three states described: no energy saving features present, energy saving features present and enabled, energy saving features present, but disabled. Computers with energy saving features have a lower power draw than those without, and only those computers with energy saving features enabled enter low power mode.
The study by Nordman (1999) is similar in that it compares the annual energy consumption of computers and monitors that comply with the Energy Star[12] scheme, with those that do not comply with the scheme. To comply with the Energy Star scheme, computers and monitors must have a low power mode and their power draw must be below a specified level. As such, Energy Star compliant computers are likely to have a lower average power draw than non-compliant computers and the average usage pattern of Energy Star compliant computers will include a low power mode.
Comparing the research results
The study by Mungwititkul and Mohanty (1997) indicates that computers are almost always turned off at night. As such their ’no energy saving’ usage pattern is similar to the ‘off at night’ usage pattern in the study by Webber et al (2006). If you consider the lower power draw of the study by Mungwititkul and Mohanty (1997), the annual energy consumption for these states, 80kWh (Mungwititkul and Mohanty: 1997) and 100kWh (Webber et al 2006), seems comparable.
Similarly, the ’energy saving enabled’ usage pattern (Mungwititkul and Mohanty: 1997) and the ’turned off at night with power management’ usage pattern (Webber et al 2006) in these two studies are comparable. They give annual energy consumption estimates of 52kWh and 86kWh respectively. Once again, these studies use a different power draw for the computers. The study by Mungwititkul and Mohanty (1997) uses a lower power draw for this usage pattern (36W) than for the ’no energy saving’ pattern (48W) described above. In contrast, the study by Webber et al (2006) uses a power draw of 55W for all usage patterns.
We can also compare the two studies that give average annual energy consumption (Roth et al: 2002, Kawamoto et al: 2001) with the study by Webber et al (2006). These three studies all use the same power draw in their calculations.
The average annual energy consumption of the four usage patterns described by Webber et al (2006) is 231kWh. This average energy consumption assumes equal proportions of computers in each of the four states described. This average falls between the higher annual energy consumption of 297kWh found by Roth et al (2002), and the lower annual energy consumption of 213kWh found by Kawamoto et al (2001).
The higher average energy consumption in the study by Roth et al (2002) may be explained by the higher proportion of computers in active mode, while the lower average energy consumption in the study by Kawamoto et al (2006) may be explained by the higher proportion of computers turned off at night.
Monitors
Monitors show a much greater variation in annual energy consumption than computers, ranging from 22kWh to 754kWh per year.
The factors that cause variation in the annual energy consumption of monitors are the same as those that cause variation in computers discussed above.
In addition, there is also a large difference between the average power consumption of LCD monitors and the average power consumption of CRT monitors. LCD monitors require much less energy.
Annual energy consumption (kWh/year) | Usage pattern | Power draw (watts) | Assumptions | Source |
205 | active= 19h/week low power= 61h/week off= 88h/week | active= 85 low power= 5 off= 0.5 | The usage pattern is for power managed computers. For non power managed computers, the time given for low power is assumed to be active time. Assumes 25% of computers are power managed and 65% are turned off at night. | Kawamoto et al (2001) |
112 | no energy saving features | active= 67 (non-PM monitors) | Assumes all monitors are turned off at night. Assumes typical usage pattern for all computers and monitors is: active= 9%, low power= 10%, off= 81% of the year. | Mungwititkul and Mohanty (1997) |
110 | energy saving disabled | active= 66 (PM monitors) low power= 15 | ||
65 | energy saving enabled | |||
754 | CRT always on (on= 99%) | active= 85 low power= 5 off= 0.5 | Annual energy consumption assumes 235 business days per year, based on 25 days off per year for holidays, sickness, and travel. Note: the figures reported in the study do not equal 100%. | Webber et al (2006) |
136 | CRT always on + PM (on= 13%, low= 86%) | |||
141 | CRT off at night (on= 18%, 0ff= 81%) | |||
104 | CRT off at night + PM (on= 13%, low= 5%, off= 81%) | |||
131 | LCD always on (on= 99%) | active= 15 low power= 1.5 off= 0.5 | ||
29 | LCD always on + PM (on= 13%, low= 86%) | |||
28 | LCD off at night (on= 18%, off= 81%) | |||
22 | LCD off at night + PM (on= 13%, low= 5%, off= 81%) | |||
307.7 | non Energy Star compliant (active= 9.5h/day, off=14.5h/day) | Nordman (1999) | ||
110.5 | Energy Star compliant (active= 4h/day, low= 5.5h/day, off= 14.5h/day) |
Table 5: Annual energy consumption of monitors
Most of the studies looked at CRT monitors, largely because CRT monitors are still much more common in office environments than LCD monitors. The study by Webber et al (2006) highlights the difference in annual energy consumption between CRT monitors and LCD monitors.
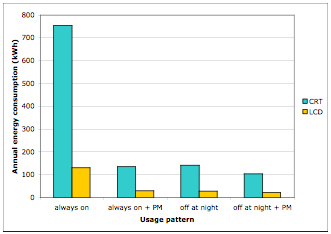
Figure 10: Annual energy consumption of CRT and LCD monitors (source: Webber et al: 2006)
The lowest annual energy consumption is achieved by a computer with LCD monitor that is turned off at night and power managed. The highest annual energy consumption is achieved by a computer with CRT monitor that is always on.[13] The latter will consume more than ten times the amount of energy every year.
Energy consumption of Mac computers
Although some of the research includes Mac computers in their sample, they rarely report the results separately. We did not find any research that focused solely on Mac computers. As such, there are no average values for the energy requirements of Mac computers. Some studies did report energy measurements for individual computers.[14]
Table 6 summarises the results of these studies.
Description | Power draw (watts) | Notes | Source | |||
Active | Light sleep | Low power | Off | |||
iMac G3 | 88 | 78 | 31 | 4 | Integrated computer system combining computer and CRT monitor. Running Mac OS 9.2 | Roberson et al (2002) |
Mac G4 | 131 | 102 | 10 | 8 | Integrated computer system combining computer power linked to Apple Studio Display LCD monitor. Running Mac OS X. | Roberson et al (2002) |
Mac 7200 | 46 | - | 28 | - | Nordman (1999) | |
- | 47 | - | - | 2-3 | Results are an average figure, not for a specified model. | Kawamoto et al (2001) |
Table 6: Energy requirements of older Mac computers
Many of the newer model Mac computers combine the computer and monitor in a single unit. These are referred to as ‘integrated computer systems’ in the research literature.[15]
As the computer and monitor are combined, their energy requirements cannot be measured separately. However, it is quite common for the monitor to enter low power while the computer remains active. Measurements by Bluejay (2006) indicate that this saves 35W.[16]
When you consider independent LCD monitors save 18W-51W in low power mode (Roberson et al: 2002), a saving of 35W when only the monitor is in low power mode seems reasonable.
Based on the environment specifications provided by Apple, current model Macs are more energy efficient than older models. Most current model Macs are also more energy efficient than the average results reported by the studies.
Table 7 sets out the energy requirements of current model Mac computers. Table 8 estimates the annual energy consumption of current model Mac computers for different usage patterns.
Description | Power draw (watts) | Notes | ||
Active | Low power | Off | ||
Mac Mini | 21 - 23 | 2.3 - 2.4 | 1.3 - 1.5 | Computer only |
17" iMac | 44 - 56 | 3.1 - 3.6 | 2.2 - 2.6 | Computer and 17" LCD monitor combined |
20"iMac | 83 - 84 | 3.4 - 3.5 | 2.5 - 2.7 | Computer and 20" LCD monitor combined |
24" iMac | 116 - 120 | 4.1 - 4.5 | 2.6 - 2.8 | Computer and 24" LCD monitor combined |
Mac Pro | 250 | 13 | 2 | Computer only |
Table 7: Energy requirements of current model Mac computers (source: Apple Product Environmental Specifications)
Description | Annual energy consumption (kWh) | Usage pattern | Power draw (watts) | Notes |
Mac Mini | 183 | always on | active= 21 low power= 2.3 off= 1.3 | computer only |
46 | off night no PM[17] | |||
44 | always on + PM | |||
31 | off night + PM | |||
17" iMac | 384 | always on | active= 44 low power = 3.1 off= 2.2 | computer and 17" LCD monitor combined |
98 | off night no PM | |||
79 | always on + PM | |||
64 | off night + PM | |||
20" iMac | 752 | always on | active= 83 low power= 3.4 off= 2.5 | computer and 20" LCD monitor combined |
180 | off night no PM | |||
131 | always on + PM | |||
116 | off night + PM | |||
24" iMac | 1013 | always on | active= 116 low power= 4.1 off= 2.6 | computer and 24" LCD monitor combined |
250 | off night no PM | |||
178 | always on + PM | |||
160 | off night + PM | |||
Mac Pro | 2184 | always on | active= 250 low power= 13 off= 2 | computer only |
525 | off night no PM | |||
415 | always on + PM | |||
334 | off night + PM |
Table 8: Annual energy consumption of current model Mac computers[18]
With the exception of the 24" iMac and the powerful, high end Mac Pro, the annual energy consumption of current model Mac computers compares favourably with the results reported by the studies for average computers.
Indirect energy use
In addition to the considerable direct contribution computers and monitors make to the energy consumption of an office, they also make an indirect contribution to energy consumption.
The study by Roth et al (2002) found that office equipment increases the load on air conditioning by 0.2-0.5kW per kilowatt of office equipment power draw.
So, for every kilowatt of electricity your computers use, your air conditioning system uses an extra 0.2-0.5kW to keep the office cool. Reducing the electricity consumption of computers reduces the heat they produce, and thereby reduces the burden on your air conditioning system.
Potential savings of power management
Reducing the energy consumption of computers and monitors is simple, and it does not require investing in newer models. Turning computers off at night and putting them into low power mode when they are idle can reduce their annual energy consumption by more than half.
Power management can be done manually or automatically.
Manual power management requires users to physically turn off their computer or put it into low power mode. As such, it requires an education program. Achieving consistently high levels of manual power management in a large organisation can be difficult.
Automatic power management (either by properly configuring any built in power management features, or using third party software) can theoretically ensure 100% of computers are turned off at night and in low power mode when idle. In practice, some software and network equipment can prevent power management (Picklum et al: 1999).
Automatic power management versus user education
Most new computers come with built in energy saving features, and yet only 25% of computers and 60% of monitors have power management features enabled (Nordman et al: 2000).
Energy saving features are disabled on the majority of computers either because individual users have disabled them, or because of glitches during set up (Picklum et al: 1999).
The study by Picklum et al (1999) showed that user education programmes can be successful in reducing computer energy use. These programmes focused on turning computers and monitors off at night, they did not address idle time.
The study found that user education can result in 90-95% of computers being turned off at night. However, achieving such impressive results requires users to have hands-on training, which can be costly and time-consuming.
Basic user education programmes, involving e-mailing staff and putting posters on notice boards, resulted in approximately 70%-80% of computers turned off at night (Picklum et al: 1999).
While an improvement, these results are only marginally better than the average found by the same study; two thirds of computers (66%) were turned off at night. The researchers also suggest that to maintain the results, the education programme has to be ongoing (Picklum et al: 1999).
Automatic power management, which turns computers off at night and puts them into low power mode after a period of inactivity, can ensure that all computers are as energy efficient as possible.
Although automatic power management tends to have higher up front costs, it removes the need for ongoing user education, and does not rely on changes in user behaviour to achieve results.
Potential savings of power management
Effective power management can save 1046kWh per computer and CRT monitor per year,[19] or 505kWh per computer and LCD monitor per year[20] (Webber et al: 2006). This adds up to savings of $50-$100 per computer and monitor every year.[21]
Even organisations with a small number of computers can make significant savings on their electricity costs.
Usage patterns are the key to reducing energy consumption
Even the most energy efficient computers can save energy if they are properly power managed. The Mac Mini, which draws just 21W when active, can save 152kWh per year if it is effectively power managed.[22]
Energy efficiency of computers and monitors certainly plays a role in reducing energy consumption. Arguably, the energy efficiency of monitors is more important than the energy efficiency of computers, as monitors show much greater variation in their energy requirements.
However, the most important determinant of overall energy consumption is not how energy efficient the computer is, but how it is used.[23]
Effective power management results in much higher savings than simply using computers that are more energy efficient.
References
Apple Product Environmental Specifications, Apple Computer, Inc (as of November 2006).
https://web.archive.org/web/20090822055357/http://www.apple.com:80/environment/resources/specs.html
Bluejay, M. (2006), Saving Electricity web page. https://michaelbluejay.com/electricity/computers.html
Kawamoto, K., Koomey, J. G., Nordman, B., Brown, R. E., Piette, M. A., Ting, M. and Meier, A. K. (2001), ‘Electricity Used by Office Equipment and Network Equipment in the US: Detailed Report and Appendices’, LBNL-45917, Lawrence Berkeley National Laboratory, California.
http://enduse.lbl.gov/Projects/InfoTech.html
Kawamoto, K., Shimoda, Y. and Mizuno, M. (2004), ‘Energy Saving Potential of Office Equipment Power Management’, Energy and Buildings, 36, pp915-923.
Mungwititkul, W. and Mohanty, B. (1997), ‘Energy Efficiency of Office Equipment in Commercial Buildings: The case of Thailand’, Energy, 22:7 pp673-680.
Nordman, B. (1999), ‘Power Levels, Operating Patterns and Energy Use’, Lawrence Berkeley National Laboratory, California.
Nordman, B., Meier, A. and Piette, M. A. (2000), ‘PC and Monitor Night Status’, Lawrence Berkeley National Laboratory, California. http://repositories.cdlib.org/cgi/viewcontent.cgi?article=1790&context=lbnl
Picklum, R.E., Nordman, B., Kresch, B. (1999), ‘Guide to Reducing Energy Use in Office Equipment’.
Roberson, J. A., Homan, G. K., Mahajan, A, Webber, C. A., Nordman, B., Brown, R. E., McWhinney, M. and Koomey, J. G. (2002), ‘Energy Use and Power Levels in New Monitors and Personal Computers’, LBNL-48581, Lawrence Berkeley National Laboratory, California.
http://enduse.lbl.gov/Projects/OffEqpt.html
Roth, K. W., Goldstein, F. and Kleinman, J. (2002), ‘Energy Consumption by Office and Telecommunications Equipment in Commercial Buildings: Volume I’, Arthur D. Little, Inc. (reference: 72895-00), Report for Office of Building Equipment, Massachusetts
Webber, C. A., Roberson, J. A., Brown, R. E., Payne, C. T., Nordman, B. and Koomey, J. G. (2001), ‘Field Surveys of Office Equipment Operating Patterns’, LBNL-46930, Lawrence Berkeley National Laboratory, California. http://enduse.lbl.gov/Projects/OffEqpt.html
Webber, C. A., Roberson, J. A., McWhinney, M. C., Brown, R. E., Pinckard, M. J. and Busch, J. F. (2006), ‘After-hours Power Status of Office Equipment in the USA’, Energy, 31, pp2823-2838.
Appendix A: Calculations for annual energy consumption of current model Mac computers.
To calculate the annual energy consumption of current model Mac computers we used the lowest power draw for each model as reported in the Apple Products Environmental Specifications (as of November 2006).
Although we have adopted the terminology for usage patterns from Webber et al (2006), the usage patterns used for current model Mac computers differ from the usage patterns used in the study by Webber et al (2006).
The usage patterns used in the calculations for annual energy consumption of current model Mac computers can be found in Table 9.
Usage pattern | Time spent in power state (hours/day) | ||
Active | Low power | Off | |
always on | 24h x 7 days | 0 | 0 |
off night no PM | 8h x 5 days | 0 | (16h x 5 days) + (24h x 2 days) |
always on + PM | 4.9h x 5 days | (19.1 h x 5 days) + (24h x 2 days) | 0 |
off night + PM | 4.9h x 5 days | 3.1h x 5 days | (16h x 5 days) + (24h x 2 days) |
Table 9: Usage patterns for annual energy consumption of current model Mac computers
The ‘always on’ usage pattern indicates that the computer is never turned off, and is always in active mode.
The ‘off at night no PM’ usage pattern indicates that the computer is turned off at night and on weekends, but is always in active mode when it is turned on.
The ‘always on + PM’ usage pattern indicates that the computer is never turned off, but will enter low power mode after a period of idle time.
The ‘off at night + PM’ usage pattern indicates that the computer is turned off at night and on weekends, and will enter low power mode after a period of idle time.
These usage patterns were derived from the typical usage patterns found in the studies we looked at. We have assumed that the computers are used between 9:00am and 5:00pm on weekdays, with a 1.1 hour lunch break.
The low power estimates are based on the study by (Kawamoto et al: 2004). We assume that the idle delay period is 15 minutes.
The calculations for the ‘off at night + PM’ usage patterns are set out in Table 10. The other usage patterns were derived from this one.
Off | 16 hours x 5 days (weekdays) | |
24 hours x 2 days (weekend) | ||
On | 8 hours x 5 days | |
in use | 6.9 hours/weekday | |
lunch | 1.1 hours/weekday | |
Break down of 6.9 hours 'in use' | ||
active use | 3 hours/weekday | |
idle use | 3.9 hours/weekday | |
Break down of 3.9 hours 'idle use' | ||
active idle time | 1.9 hours/weekday | |
low power idle time | 2 hours/weekday | |
Weekday | Weekend | |||
off | 16 hours | off | 24 hours | |
active | 4.9 hours | (3 hours active use + 1.9 hours active idle time) | ||
low power | 3.1 hours | (1.1 hours lunch + 2 hours low power idle time) | ||
Table 10: Calculations for usage pattern ‘off at night + PM’
[1] Based on the study by Webber et al (2006). Compares the annual energy consumption of computers with power management and those without power management.
[2] Based on the study by Webber et al (2006). Compares the annual energy consumption of computers in ‘always on’ state and those in ’turned off + power management’ state.
[3] The study by Kawamoto et al (2004) indicates that laptop computers are very popular in Japanese offices. Laptop computers account for 40% of all computers in Japanese offices.
The study by Webber et al (2006) found that laptop computers accounted for 10% of all computers in their research sites, however in two of the sites studied, laptop computers accounted for more than 50% of all computers.
[4] Nordman et al (2000) indicated that there is anecdotal evidence to suggest that nighttime turn off rates for computers and monitors are lower in the private sector than in the public sector.
[5] The power draw values found by Kawamoto et al (2001) are widely used by subsequent studies. As such, it is worth looking at them in more detail. By taking their own measurements, and looking at measurements reported in previous studies, they found computers used between 30W and 60W when active, 25W in low power, and between 1W and 3W when turned off. From this, they calculated that, on average, a computer uses 55W when active, 25W in low power, and 1.5W when off.
[6] The difference in energy requirements decreases for larger monitors because larger LCD monitors require more energy per square inch than smaller LCD monitors.
For 15" monitors, an LCD monitor requires 30% of the energy of a CRT monitor. Whereas for 17" monitors, an LCD monitor requires 51% of the energy of a CRT monitor (Roberson et al: 2002).
[7] The researchers note there was difficulty determining whether some computers were in low power mode, and that that a number of the research sites use operating systems that do not support power management. This accounts for the high proportion of computers still active at night (Webber et al: 2001).
[8] It is worth noting that this study was conducted in Japan, which has a higher nighttime turn off rate than average. A recent study conducted in the USA (Webber et al: 2006) found only 36% of desktop computers are turned off at night.
[9] The assumptions made by researchers also influence the figures reported for annual energy consumption.
[10] The usage pattern for the ‘off at night + PM’ state was provided. The usage pattern for the other states was derived from this usage pattern. The figures reported in the study do not equal 100%.
[11] Using the power draw and usage patterns given, we could not recreate the annual energy consumption calculated in this study. Our calculations gave annual energy consumption slightly lower than the reported figures.
[12] More information about the Energy Star scheme can be found on their web site: https://www.energystar.gov/
[13] Based on the study by Webber et al (2006). A computer with LCD monitor that is turned off at night and power managed consumes 108kWh (86kWh + 22kWh). A computer with CRT monitor that is always on consumes 1236kWh (482kWh + 754kWh).
[14] As these results are based on the measurements of a single computer, they are indicative only. They do not account for possible differences in power draw between other computers of the same model.
[15] The study by Roberson et al (2002) gives results for three integrated computer systems, two of which are Mac.
[16] The results are based on a 20" G5 iMac. These results are for a single computer. As such they are indicative only.
[17] For the PM states, we have assumed the computer enters low power mode after 15 minutes idle time.
[18] An explanation of the usage patterns and calculations can be found in Appendix A.
[19] The average computer that is always on uses 482kWh per year. The average CRT monitor that is always on uses 754kWh per year. Their combined energy consumption is 1236kWh per year.
The average computer that is turned off at night and power managed uses 86kWh per year. The average CRT monitor that is turned off at night and power managed uses 104kWh per year. Their combined energy consumption is 190kWh per year. The saving is 1046kWh per year (1236kWh-104kWh=1046kWh).
[20] The average computer which is always on uses 482kWh per year. The average LCD monitor which is always on uses 131kWh per year. Their combined energy consumption is 613kWh per year
The average computer which is turned off at night and power managed uses 86kWh/year. The average LCD monitor which is turned off at night and power managed uses 22kWh per year. Their combined energy consumption is 108kWh per year. The saving is 505kWh per year (613kWh-108kWh= 505kWh).
[21] Based on electricity costs of $0.10/kWh. Savings of $50 is based on a computer and LCD monitor. Savings of $100 is based on a computer and CRT monitor.
505kWh x $0.10= $50.50 (computer and LCD monitor)
1046kWh x $0.10= $104.60 (computer and CRT monitor)
[22] Based on the energy consumption always on compared to energy consumption if turned off at night and power managed (183kWh - 31kWh = 152kWh).
[23] As an example, a 17" iMac draws 44W when active whereas a 20" iMac draws 83W when active. If both are always on they will have an annual energy consumption of 384kWh and 752kWh respectively. Buying the more energy efficient 17" iMac saves 368kWh per year.
By contrast, if the 20" iMac is effectively power managed, it will save 636kWh per year.
Download as PDF
Review of Computer Energy Consumption and Potential Savings by Megan Miln (née Bray).